Blog Archive for May 2009
UP & Digital 3-D Technology
 First of all, yesterday I went out and saw Pixar's latest film, Up, and it was a blast. As usual, the cartoony but more-and-more realistic-looking animation was superb. The plotline was very touching at points but still contained enough eye candy and silly jokes ot keep everyone on the edge of their seat and laughing. In short, it was another great Pixar film, although I'm not yet sure where it will go in my personal favorites; that can only be determined over time, I think.
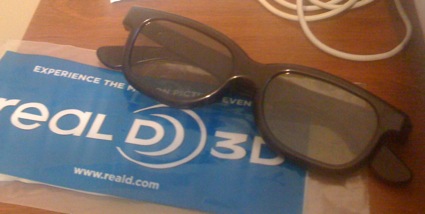
This afternoon, though, I took the chance to rewatch the film in "Disney Digital 3D", which is just Disney's fancy branding to the RealD digital technology. Unlike old 3D glasses that used separate polarization or colors to each eye, RealD uses a more advanced polarization on alternating frames of the digital projection. This results in a much crisper picture than the older 3-D technologies, but it still suffers from a slightly dark look due to the polarization, although that might be due to the fact that I was sitting almost at the front of the theater.

My experience with seeing it in 3-D wasn't amazing, but I did find it interesting. Only at a couple points in the film did the characters or sets seem to jump out of the screen for me, but when they did, the effect was pretty cool. Most of the time, the 3-D effect was subtle or barely noticeable, or at least subtle enough that I couldn't decide if it looked much better than the regular 2-D projection. On the other hand, when the film was showing photos or artwork on a wall, it definitely felt more flat to me, so maybe it's just my imagination building last night's show into 3-D. I think, to Pixar's credit, they never stooped to the level of making shots just so they wow the audience in 3-D, but they only used it to full effect when it filled the story. (I've seen numerous previews for other movies where it just seems that all the characters are sticking their face right up to the camera, which might be overwhelming but at least seems gimmicky to me.)
My main disclaimer on this front is that I do have an eye condition that does make it hard for me to see things far away (I'm almost legally blind, but not quite), and it may be that part of this condition makes it less exciting to me. People often ask me what I can see compared to them, and I tell them that I've never seen like them so I cannot really compare.
I guess my point is that the 3-D technology in films these days is much better than it was even a couple years ago. If it sounds intriguing to you, check out the new world of 3-D films and see for yourself if you like the experience. And speaking of which, besides a bunch of new films coming out in 3-D over the next year, it seems that both Toy Story and Toy Story 2 are going to be released in Disney Digital 3D over the next year before Toy Story 3 is released in June 2010.
Wolfram Alpha: The Google of Data
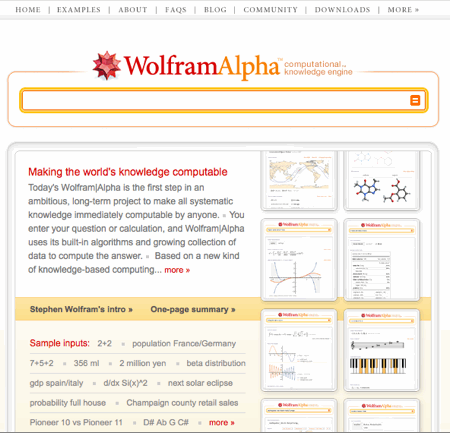
Last week, a new tool called Wolfram Alpha debuted on the internet after a couple months of hype about it. At first, many claimed it was too hard to use or that it didn't do much, but I think this system needs a deeper look.
Although it looks like a search engine box, this web site's input box is more like the input line on Wolfram Research's most famous product, Mathamatica. I'll admit that I played with it for a couple minutes during a college Calculus course, but I couldn't make head nor tails of what to do with it either. However, I can see a future where Wolfram Alpha is used as much for finding useful data as Google is for finding important sources and documents. And I think that's what the folks at Wolfram Research want to do: get as much useful data and let people crunch it in as many ways as they like.

So what can we do? I put in my first name, "Daniel", and found that it's the 5th most popular name in the US as of 2007. It also includes a graph of approximate age of those named "Daniel", and wouldn't you know, my parents were just ahead of the years that "Daniel" was most popular. I can put in "GDP USA" to get some data on our nation's Gross Domestic Product, but why not put in something more interesting such as "GDP USA/Canada" to find that within the last decade our GDP was 14 times more than Canada's. That's probably more interesting. Want to know about the caffeine that gets you through the day? Here's tons of scientific data, molecular models and everything. And, of course, you can also plot graphs of data, like this one I did for the function "x^2 + 3x - 1". (I wonder if this will replace a graphing calculator on our phones in a couple years?) Also, I remember there being a heat wave in the middle of May 2001 and the dorm was really hot, so I entered "weather may 2001" and it picked up my current location and plotted the temperature and many other weather metrics. Sure enough, there were a couple 95+ degree days in there.
That's only scratching the surface of this new tool. There are examples of querying data for dozens and dozens of areas of research. One thing a friend wondered was where the system got all its data, and I found a "Source Info" link at the bottom of the page, but the "Primary Source" is usually "Wolfram curated data," which hopefully is considered more reliable to professors than Wikipedia.